The Calculations
📗Importance of this section
This is the engine of the financial forecast - an area you should not need to touch as all the formula have been built for you! This is where we take all your assumptions and build out the core forecasts over the 5 year period. If you are proficient at Excel / Google Sheets (or just want to play with the model), then you are welcome to make changes but we urge you to save a copy as it can be easily to break the model once these cells are changed.
Now, let's see what goes on under the bonnet (hood for our US friends)
The Forecast Sections
🚩Flags & Rates
This is a control part of the forecasts that has the time series and build up the inflation factor. This enables the other formula to pick up the correct dates/years for the calculations. This is a good modelling practice no matter how complicated the Financial Model.
🙌 Revenue Drivers
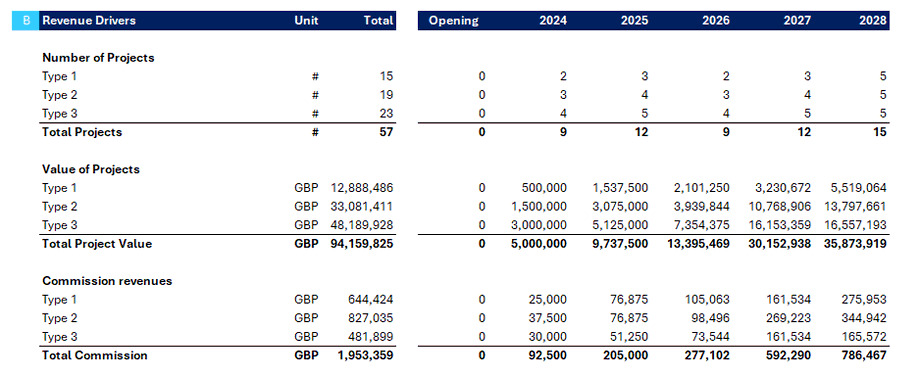
Here, we calculate the drivers of the revenue which will be dependent on the type of business model that you're forecasting. The revenue drivers are things that directly impact and generate revenue -a simplistic formula is Revenue = Price x Volume. In the case below, the revenue drivers are made up of one extra stage as this is a brokerage business. The revenue formula is
Projects x Value of projects x Project Commissions
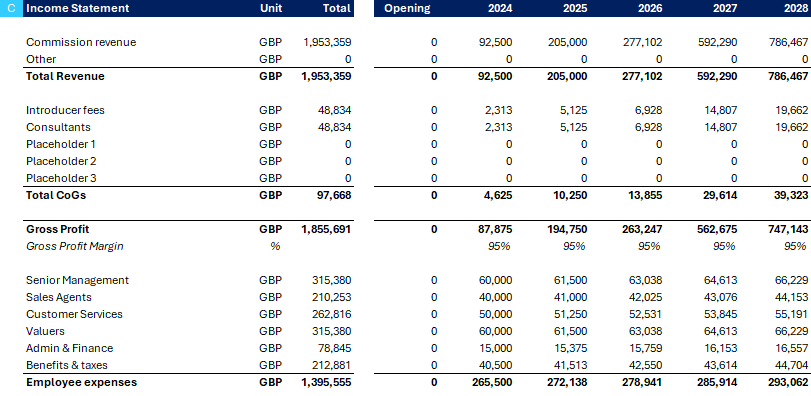
This is critical to calculating the next section, the Income Statement as the Revenue is the opening financial metric.
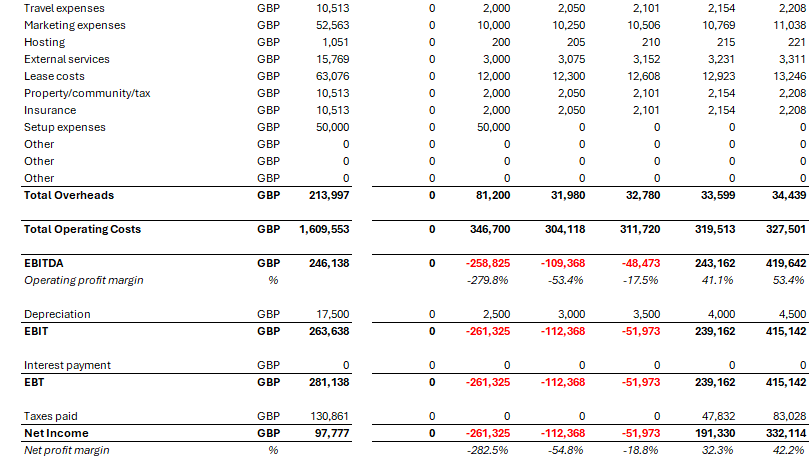
📄 Income Statement
xxx
📄 Balance Sheet
xxx
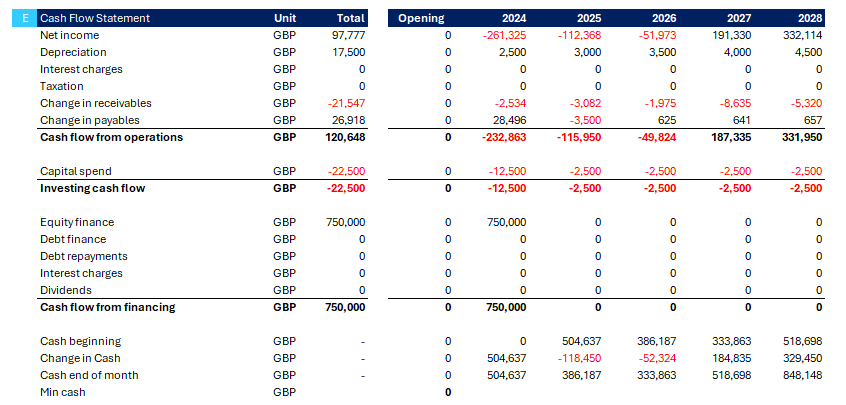
📄 Cash Flow Statement
xxx
💵 Free Cash Flow to Firm
xxx
📈 Rolling Valuations
xxx
🚗 Rolling Asset Valuation
xxx
💳 Debt Schedule
xxx
🔥 Burn Rate
xxx
🤝 Funding Flags
xxx
That's it! 👍💥 once you have done this we can head straight over to the Financial Model Calculations.


