Model Outputs - Presentation Charts
📗Importance of this section
The idea of this section is that you have the charts and tables that can easily be inserted into your investor materials such as a pitch deck or investment teaser. This section is dynamic and so will update as you change the model inputs. They are also open to be configured to reflect your branding in terms of colours and fonts.
Presentation Charts
The below charts cover the
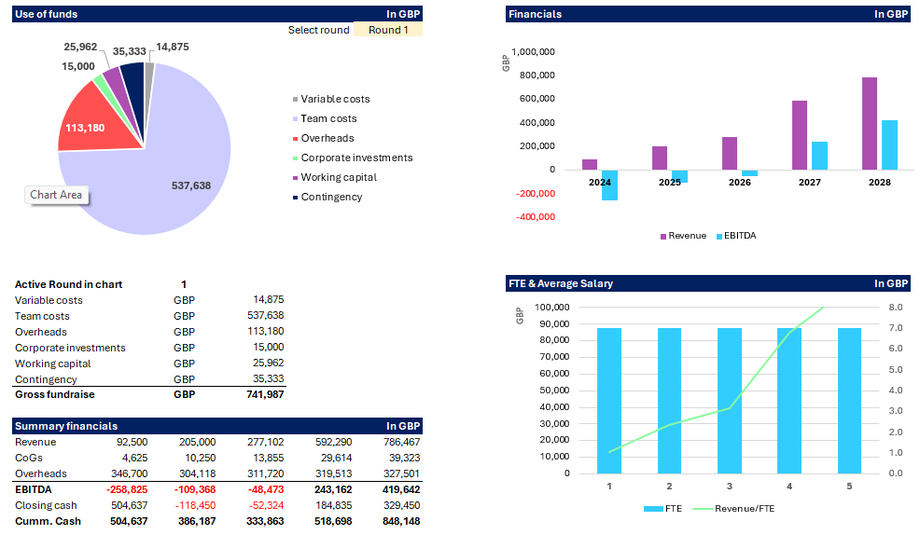
- Use of funds - this can be changed for each funding round and is important for showing the funder what you need to spend the funding on
- Summary Financials - a quick table that shows the core financials
- Financials - Bar chart showing the Revenue and EBITDA across the forecast period
- FTE & Average salary - Summary of the team expenses and evolution over the forecast period
- Rolling Valuation - Enterprise value evolution throughout the forecast period
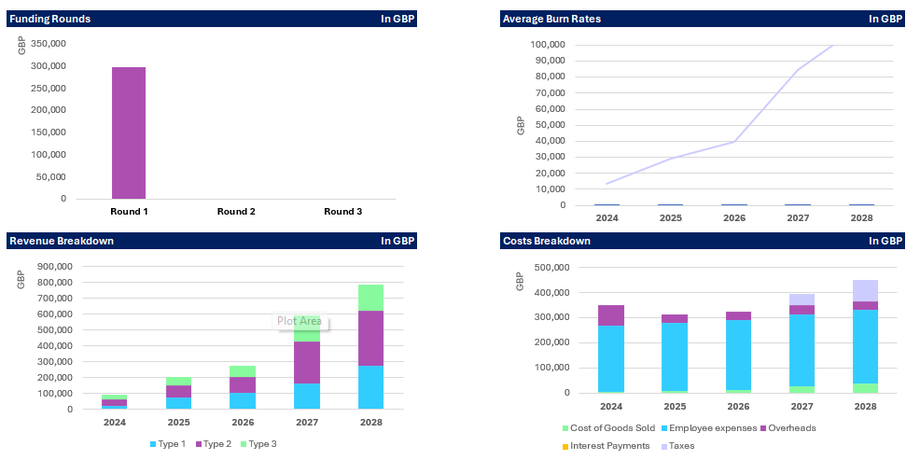
- Average burn rates - Line chart showing the average burn rate (monthly costs) over the forecast period
- Revenue breakdown - Bar chart showing the breakdown of the revenue across the forecast period
- Cost breakdown- Bar chart showing the breakdown of the costs across the forecast period
We are always looking to add to our charts so if you have any thoughts please do get in touch with us on team@numberslides.com with the subject title "One page model".
xxx


