Model Outputs - KPIs
📗Importance of this section
In this section, we summarise some of the key financial indicators of the business over the forecast period. We do this using averages, growth rates and ratios.
Revenue Drivers
This summarises your key revenue drivers and will be bespoke to your business model - it will give you an idea of the volume of work carried out, projects delivered or products sold. It is not only to assess each individual year but also the evolution over the five years and compare year on year. Generally, to be attractive to an investor or show financially viable and healthy business, you would expect all the numbers to go up year on year but this is dependent on your business situation.
🙌 Summary Stats
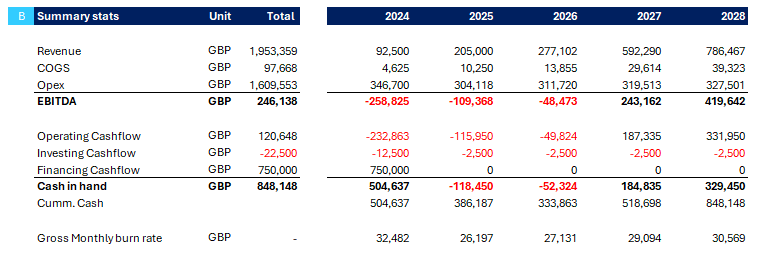
This is a beat summary table of the financials and a good sense check - as mentioned above, you would expect and hope that the key revenue numbers and profit numbers will increase year on year and that the cash position improves year on year. We also include a gross monthly burn rate, a useful stat to assess the monthly costs that need to be covered by the business - this can also increase as the business grows.
🙌 Key Ratios
🙌 Growth Rates
xxx
🙌 Rolling Valuations
xxx


